
AWS CloudTrail Integration Guide
AWS CloudTrail allows organizations to monitor system access at a more granular level. CloudTrail tracks and stores user activity and API usage. It allows data across all regions and accounts to be consolidated for better auditing, security monitoring and operational management. It helps organizations stay compliant with internal policies and regulatory standards.
TaskCall’s integration with AWS CloudTrail highlights warnings and breaches observed in the logs. Engage the correct teams immediately to address them, coupling the power of CloudTrail with TaskCall’s incident response and management system.
Pointers
- The integration is between a TaskCall service and AWS CloudTrail.
- Incidents will automatically resolve in TaskCall when metrics fall back within the normal threshold.
- Similar alerts will be automatically grouped together into one incident to avoid interrupting responders unnecessarily.
- This integration only receives alerts in TaskCall from AWS CloudTrail.
In TaskCall
- Go to Configurations > Services. Select the service you want to integrate with.
- Once you are on the Service details page, go to the Integrations tab. Click on New Integration.
- Give the integration a name.
- From the integration types, select the top radio button indicating that you are trying to use a built-in integration.
- From the list of built-in integrations, select AWS CloudTrail.
- Click Save.
- Copy the Integration Url that is issued for the integration.
In AWS Console
Several steps are involved in fully configuring CloudTrail to create incidents in TaskCall:
- Create a SNS topic with a TaskCall endpoint to send alerts to
- Create a CloudTrail and enable its logs to be sent to CloudWatch
- Create a measurable metric from the logs
- Create a CloudWatch alarm with the SNS topic created before to create incidents in TaskCall when the metric threshold is breached
In this guide we will cover each of the above steps, but you can skip through any of the parts that you are already accustomed with.
1. Create SNS Topic for Notification
- We need create a SNS topic to send alerts to TaskCall. Type SNS (Simple Notification Services) in the search bar up top. Once you are on the SNS page, go to Topics > Create topic.
- Set the topic type to Standard. Give it a name and a display name. Click Create topic.
- Once the topic is created, from the same page go to Subscriptions > Create subscription.
- For the Topic Arn select the topic you just created; set the protocol as HTTPS; paste the Integration Url you copied over from TaskCall in the Endpoint. Nothing else needs to be added. Click Create subscription.
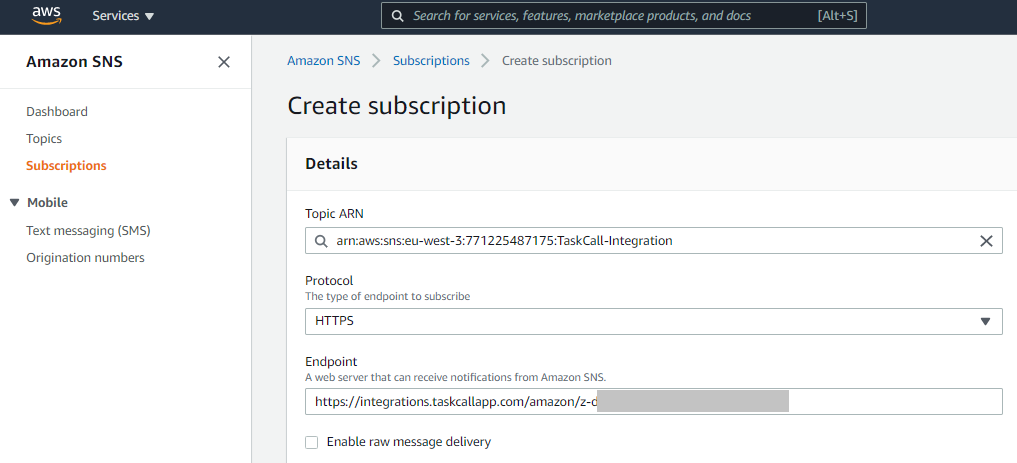
Once the subscription is created, if the "Status" shows as "Pending confirmation", then refresh the page. It will update the status to "Confirmed". - We will use this SNS topic in the CloudWatch alarm that we will create to monitor our CloudTrail.
2. Create and Enable CloudTrail for CloudWatch
- Search and select CloudTrail from the search bar.
- Click Create Trail.
- Give it a name. Select the S3 bucket the trail logs will be stored in. You can choose an existing bucket or create a new one specifically for this trail. Click Next to continue.
- Choose the event types you want to be logged. Then review and create the trail.
- After the trail has been created, we will have to enable it for CloudWatch. To do so click on the name of the trail from the list of trails.
- Scroll down to the CloudWatch Logs section. Click Edit.
- Check the Enabled box to enable trail logs to be sent to CloudWatch. Select or create a new log group that the trail will be added to. Then select or create the IAM role that will be needed to send logs to CloudWatch. Click Update trail when you are done.
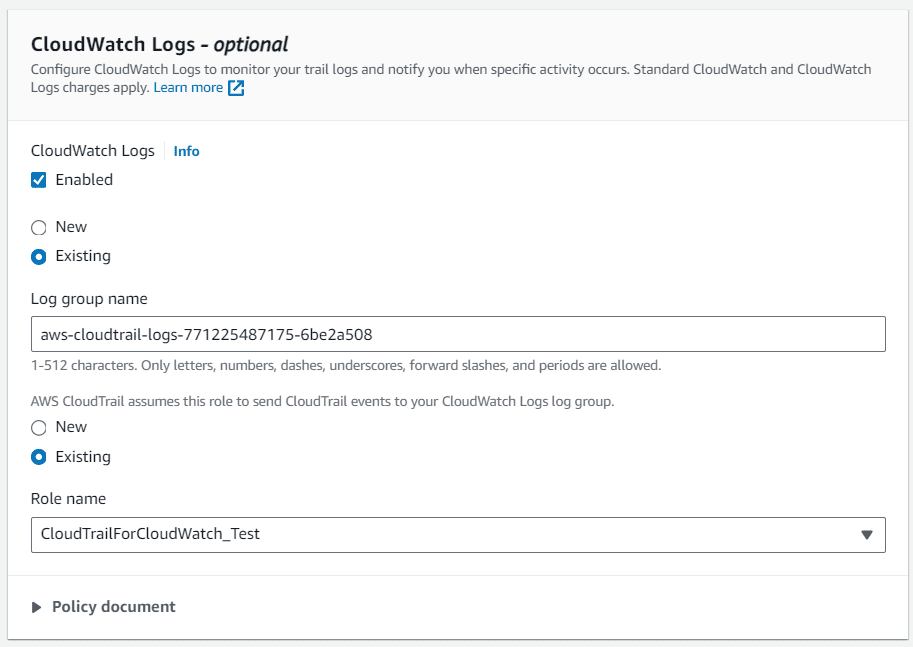
Now that you have the trail enabled for logs, you can create a measureable metric from the logs that can then in turn be monitored to create incidents in TaskCall when there are breaches. If you still need help with enabling the logs, refer to AWS's documentation on updating a trail.
3. Create Metric from CloudTrail Logs
We need to identify patterns from the logs and convert the extracted data into a quantitative metric that can then be monitored using CloudWatch.
- In the AWS console, search and select CloudWatch.
- On the navigation pane on the left, find Logs and then select Log Groups.
- You will see the CloudTrail log you created earlier listed there. Click on it.
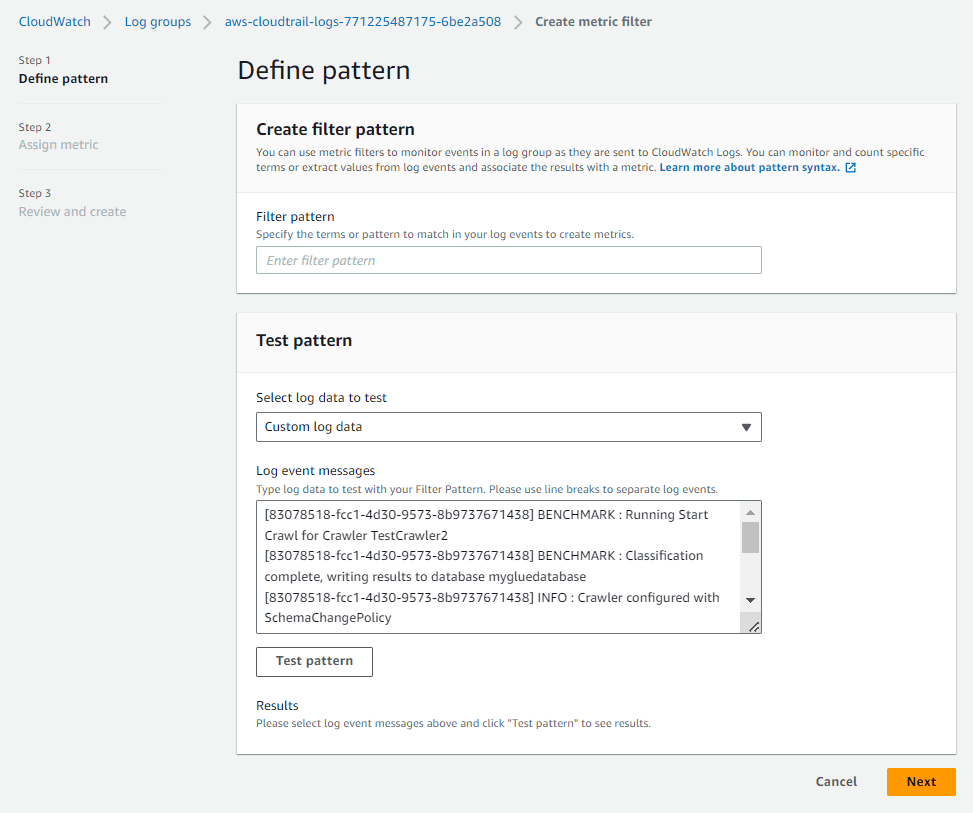
- In the next page where the details are shown, click Actions > Create metric filter.
- Define the pattern of data to extract from the logs and use in the metric. Click Next to continue.
- Then,
- Provide a filter name.
- Enter a name for the CloudWatch namespace where the metric will be published. To create a new namespace, toggle the Create new button.
- Give the metric a name.
- Define the metric value. For example, if you want to count occurrences of the defined pattern, you can specify the metric to be incremented by 1 every time the pattern is observed.
- (Optional) Define the default value of the metric.
- (Optional) Define the unit to assign to the metric.
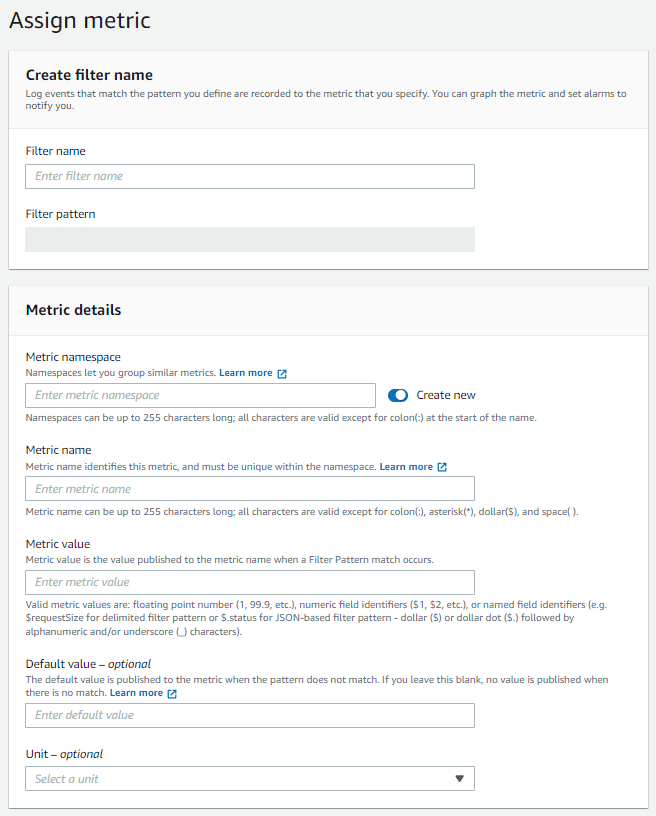
- Click Next. Finally review the metric and click Create metric filter.
Now we are only left with one last step creating a CloudWatch alarm to monitor the metric.
4. Create a CloudWatch Alarm
- In the AWS console, search and select CloudWatch.
- From the navigation bar on the left, go to Alarms > All Alarms. Then click Create Alarm.
- Select the metric you created in the previous step as the type of metric you want to monitor.
- Set the conditions and thresholds based on which the alarms will be generated. Set the type of statistic (average, sum, maximum, etc) and the period of statistical consideration for the evaluation. Define the condition type (greater than, equal to, etc) and the threshold value for the evaluation. Once you are done with this step, click Next.
- In the next step you will define the notifications that should be sent out for this CloudWatch alarm. We will define two notifications:
- when the metric is In alarm
- when the metric is Ok
For each notification, set the TaskCall SNS topic you created in the first step as the endpoint to send notifications to.
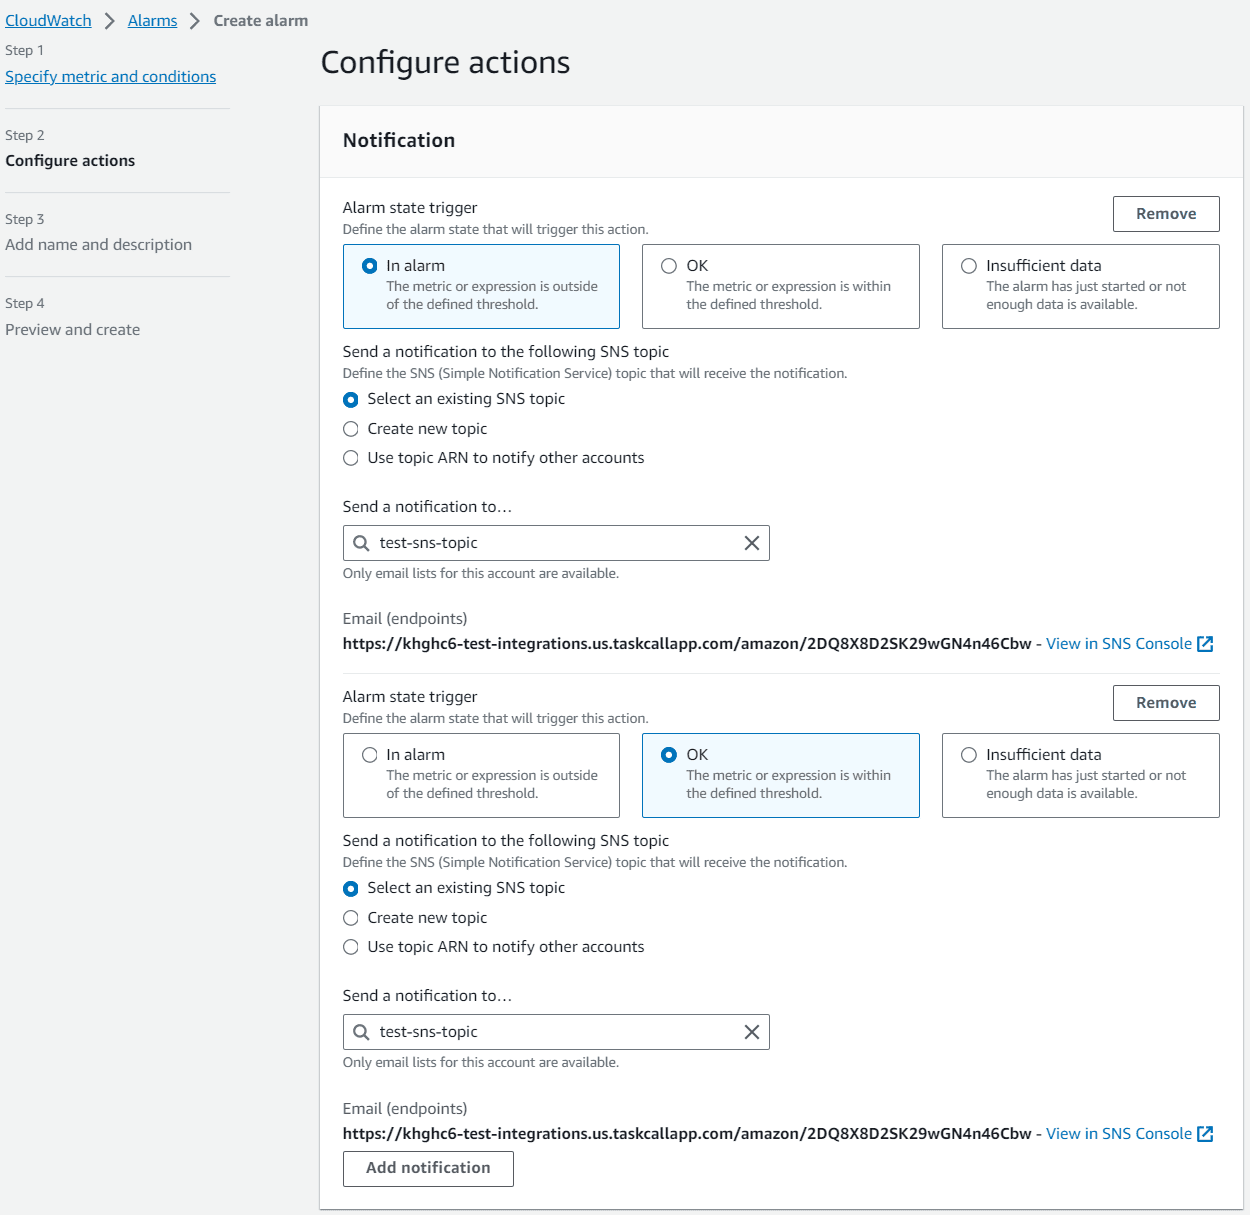
You can additionally set up the metric to trigger when there is insufficient data as well. Click Next to continue. - In the next step, you will give the alarm a name and description. Click Next to continue.
- Preview your configurations and click Create alarm when you are done.
Finally, we are done! Although there are several steps involved, once you have them all configured, you will be able to readily monitor inconsistencies and irregular behaviour from your logs immediately through incdients in TaskCall.