
Grafana Integration Guide
Grafana is an open source analytics and monitoring platform. It allows low level data to be visualized through insightful graphs and dashboards. TaskCall's integration with Grafana allows metric abnormalities identified by Grafana to be sent to on-call responders immediately for the fastest resolution. TaskCall utilizes Grafana's webhook channels to set up the integration.
Pointers
- The integration is between a TaskCall service and Grafana.
- This integration only receives alerts in TaskCall from Grafana.
- TaskCall will automatically identify alerts that are the same and group them together into one incident.
- Incidents will automatically resolve when the metrics come back within threshold on Grafana.
In TaskCall
- Go to Configurations > Services . Select the service you want to integrate with.
- Once you are on the Service details page, go to the Integrations tab. Click on New Integration.
- Give the integration a name.
- From the integration types, select the top radio button indicating that you are trying to use a built-in integration.
- From the list of built-in integrations, select Grafana.
- Click Save.
- Copy the Integration Url that is issued for the integration.
In Grafana
- Go to Alerting > Notification channels.
- Click Add channel.
- Give it a name, select webhook as the channel type and paste the Integration Url you copied over from TaskCall into the Url field. Under the Optional Webhook Settings, set the Http method to be POST. Under Notification settings, select this channel to be your default notification channel for all alerts if you want and then check the Include image box.
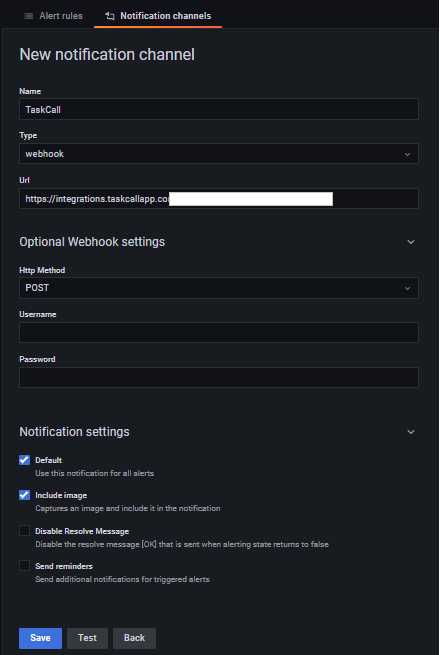
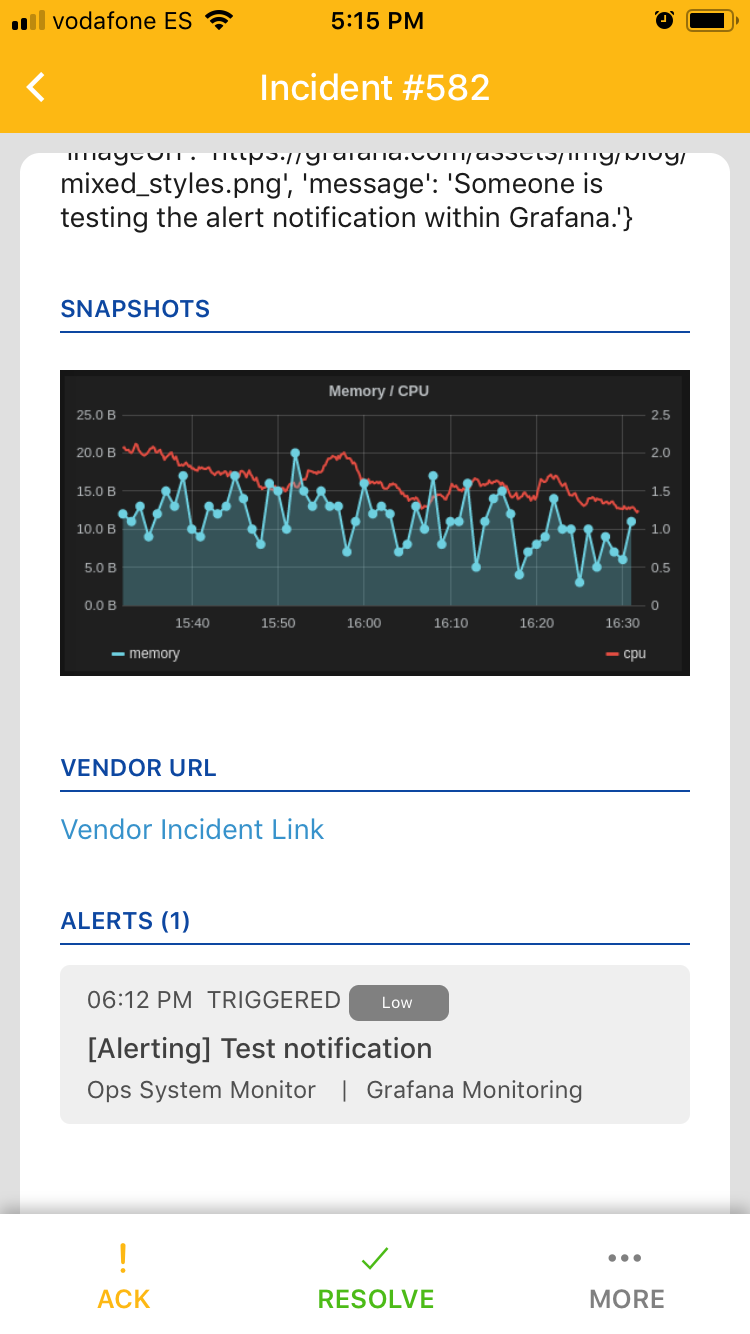
- Send a Test notification to the channel. .
- If the setup was successful then an incident would have been created on TaskCall.
- If everything looks good, then click Save.
- Done! You are ready to receive alerts from Grafana.