
Kibana Alerting Integration Guide
Kibana is an easy to use and powerful status dashboard for the ELK Stack. It allows you to visualize, explore and get insights of the data processed by your ELK Stack. TaskCall integrates with Kibana's Alerting to help you keep track of incidents raised by anomalies in your system. Readily set up alerts with thresholds to monitor your stack and address issues faster than ever before with TaskCall's notification system.
Pointers
- The integration is between a TaskCall service and Kibana.
- This integration only receives alerts in TaskCall from Kibana.
- TaskCall will automatically identify alerts that are the same and group them together into one incident.
- Incidents will automatically resolve when the metrics come back within threshold on Kibana.
In TaskCall
- Go to Configurations > Services. Select the service you want to integrate with.
- Once you are on the Service details page, go to the Integrations tab. Click on New Integration.
- Give the integration a name.
- From the integration types, select the top radio button indicating that you are trying to use a built-in integration.
- From the list of built-in integrations, select Kibana Alerting.
- Click Save.
- Copy the Integration Url that is issued for the integration.
In Kibana
- Log in to your Kibana dashboard.
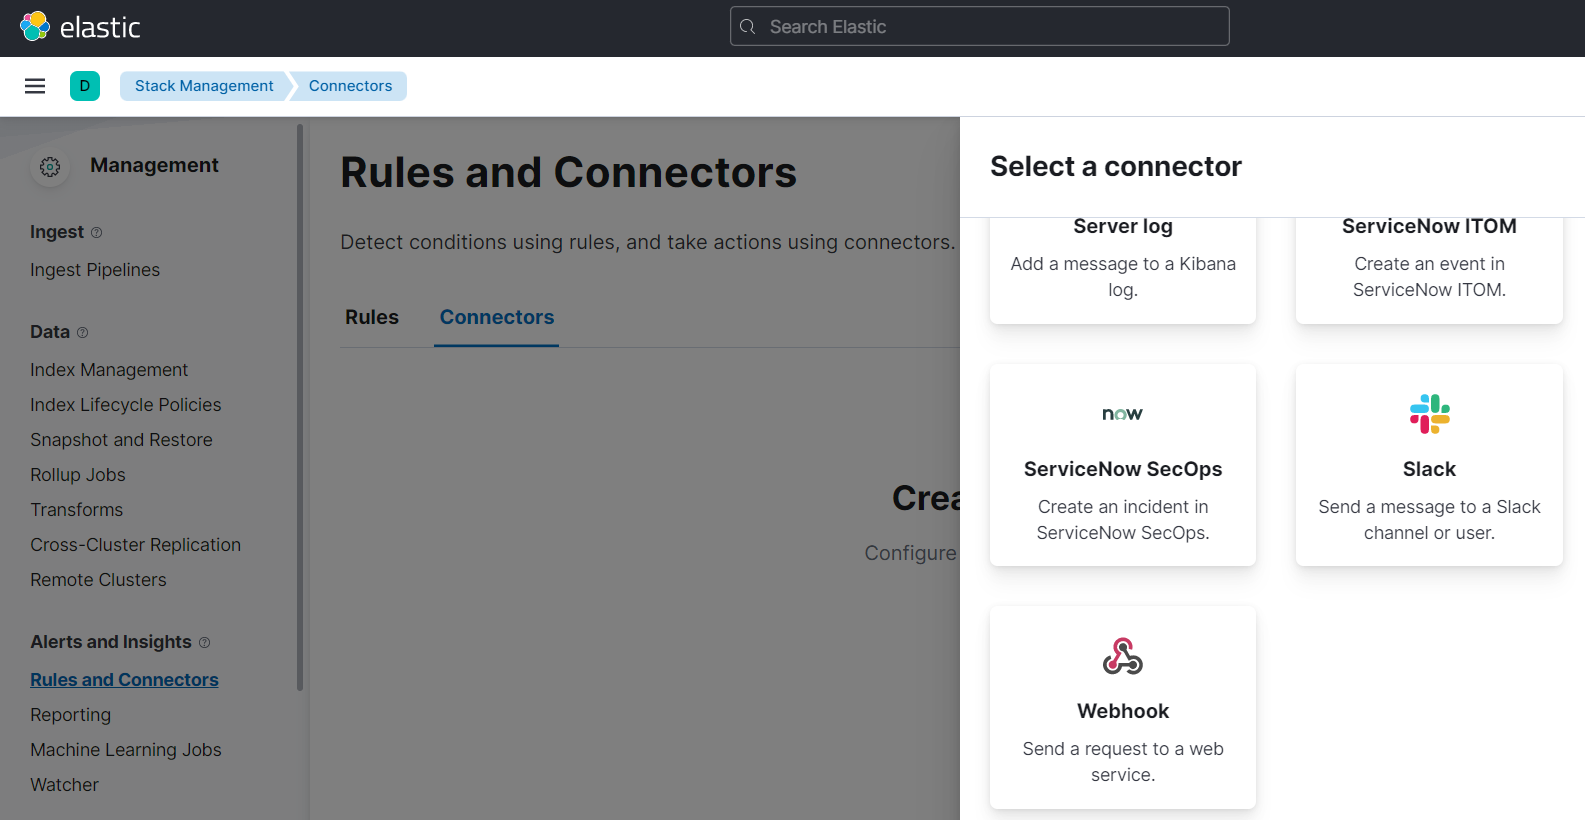
- Click on the menu icon on the top right corner. Then go to Stack Management > Rules and Connectors .
- Go to the Connector tab. Click Create connector.
- Select the Webhook connector.
- Name the connector TaskCall. Make sure the webhook method is set to POST. Paste the Integration Url you copied over from Taskcall in the URL field. Unselect the Require authentication for this webhook option. Select the Add HTTP header option and add the Content-Type header. Set the value of the Content-Type to application/json. Please make sure that you add the application/json header; the integration will fail without it.
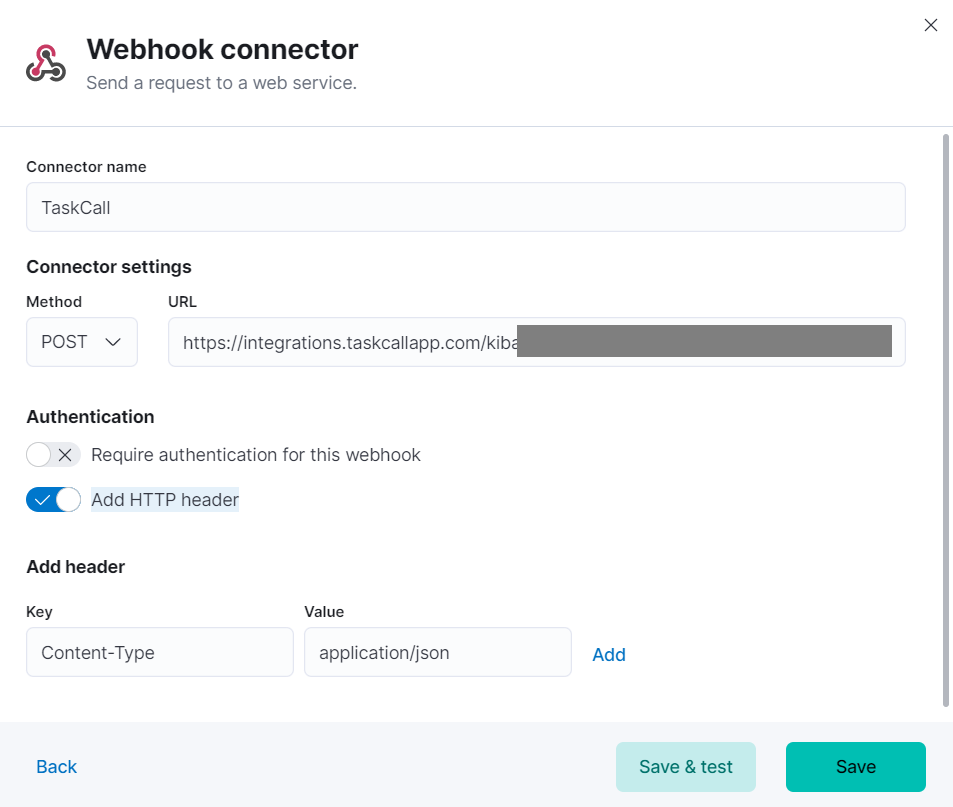
- Click Save.
- We have set up the connector. Now we have to add this connector to alert rules to receive the alerts. We will walk you through an example. We will create a CPU Usage alert here.
- On the same Rules and Connectors page, go to the Rules tab.
- Click Create rule.
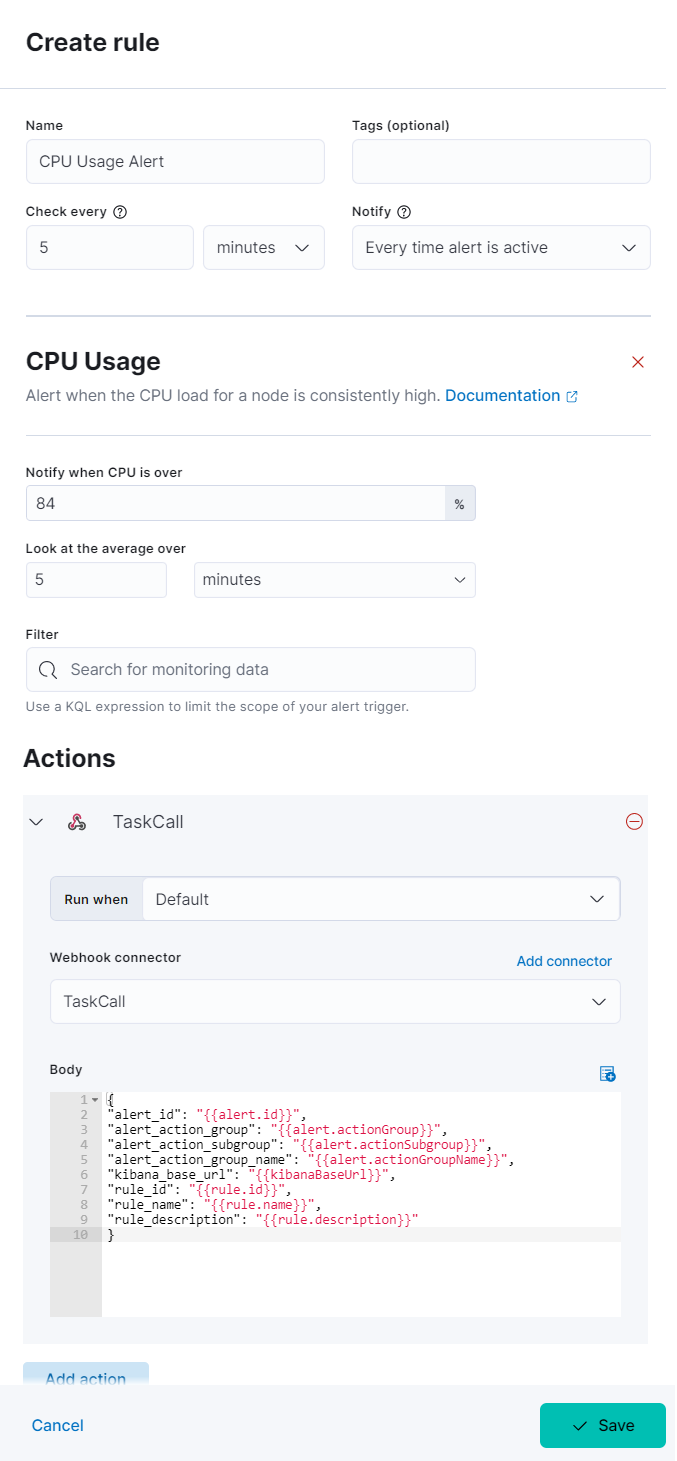
- Give the alert a name and configure how it should run. Select the Alert Type that you want (we are using the CPU Usage alert here) and set the trigger threshold.
- Select the Webhook Action and then choose the TaskCall connector your created above.
- Select when the action will run.
- In the Body section paste the below JSON payload.
{
"alert_id": "{{alert.id}}",
"alert_action_group": "{{alert.actionGroup}}",
"alert_action_subgroup": "{{alert.actionSubgroup}}",
"alert_action_group_name": "{{alert.actionGroupName}}",
"kibana_base_url": "{{kibanaBaseUrl}}",
"rule_id": "{{rule.id}}",
"rule_name": "{{rule.name}}",
"rule_description": "{{rule.description}}"
}
You can add more fields to the json payload and change the values as you wish, but the ones shown above must be included. If any of the fields are not provided, then TaskCall will fail to create incidents. The rule_name and the alert_action_group_name fields are used to set the incident title.
- Here is a snapshot of what the whole step would look like.
- If you want TaskCall to automatically resolve the alert when it resolves on Kibana, then please configure another Action to this rule and set the Run when option to Recovery.
- Click Save when you are done.
- You have set up a Connector and associated it to a Rule. Now you are all good to go. You should be receiving alerts in TaskCall from here on.